Welcome to Digital-365 for you analysis.
Start your project +971 582569990

Report Gallery
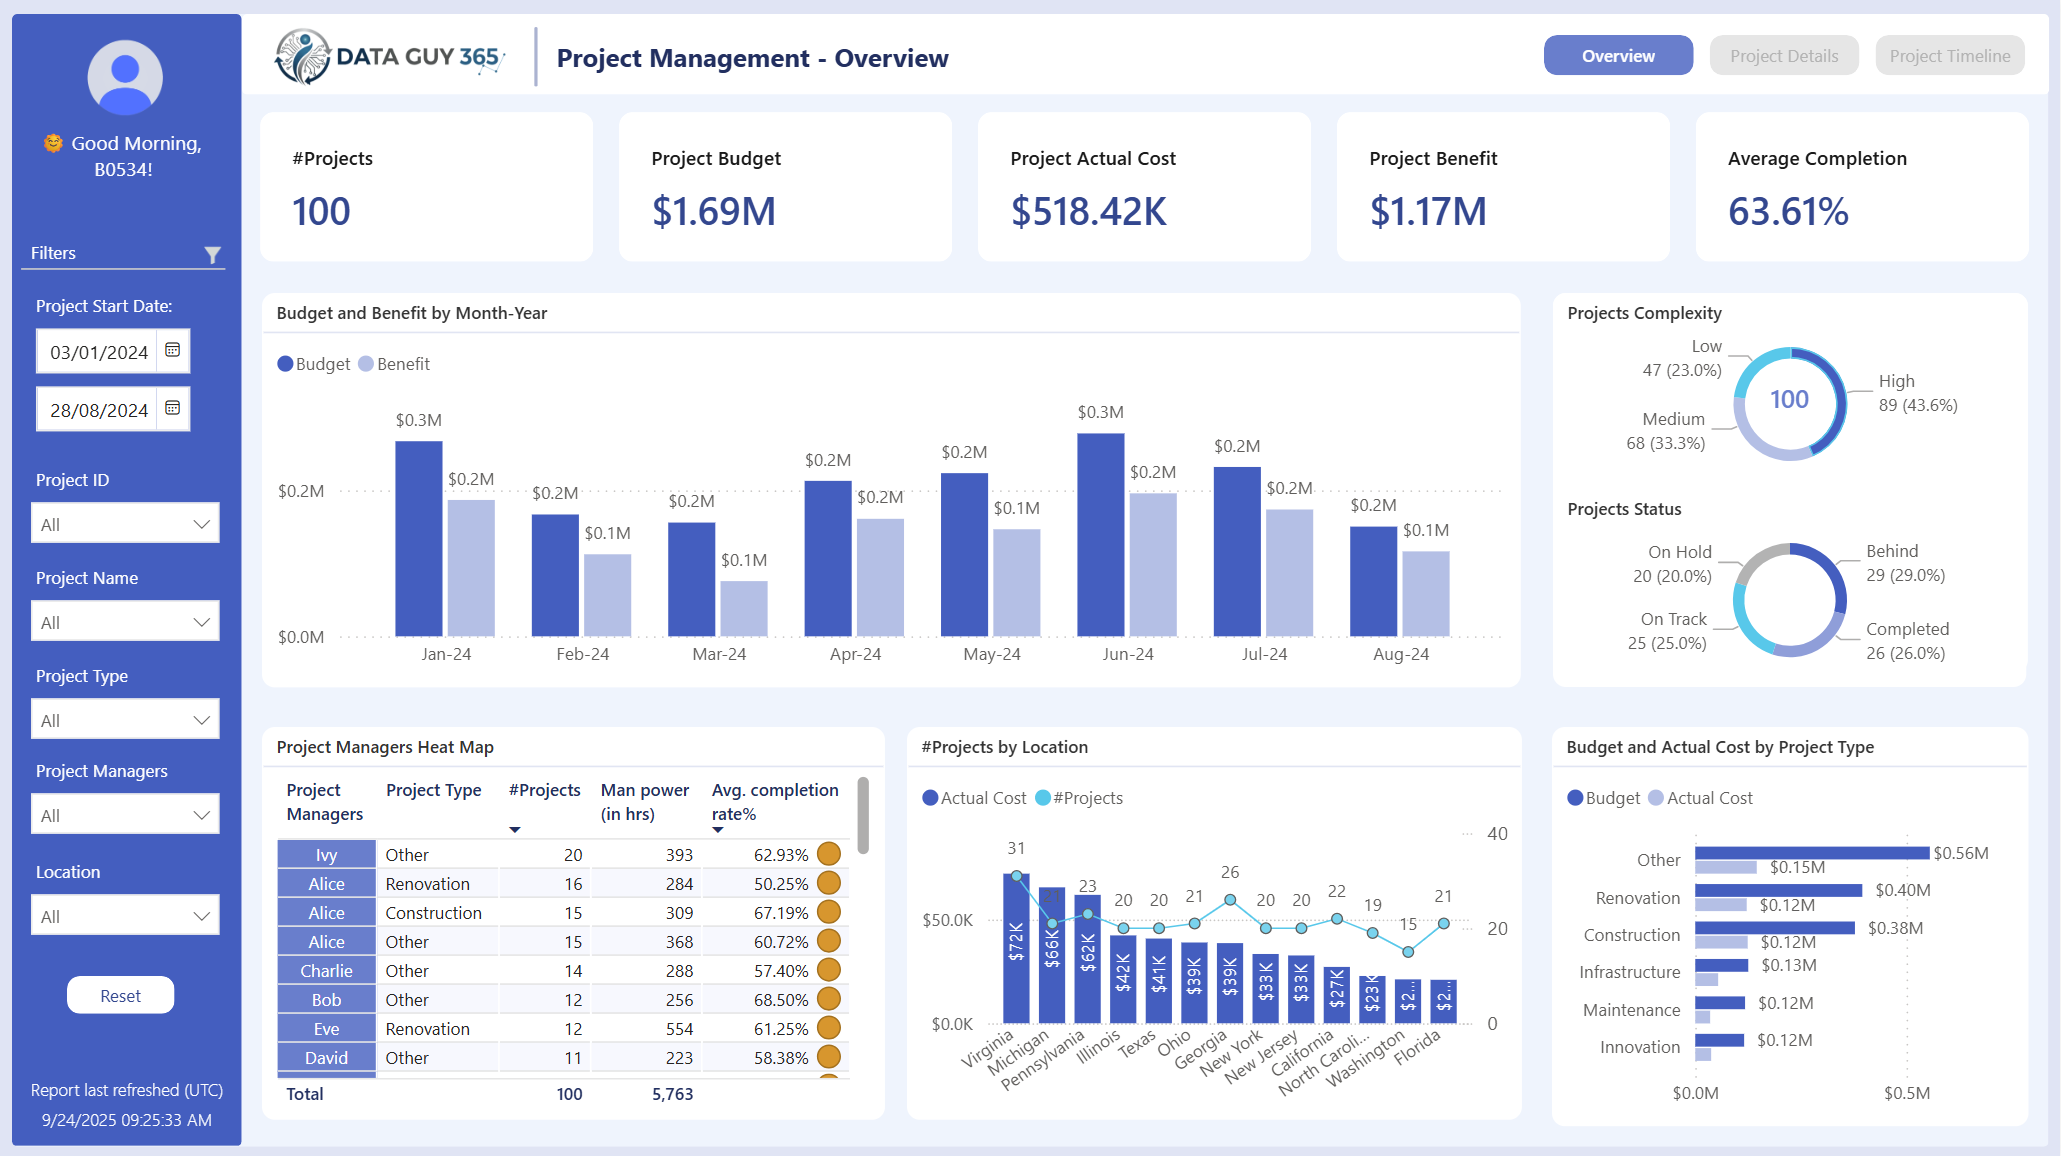
Plan. Track. Succeed—in one dashboard
This dashboard brings together High-level KPIs – Projects, Costs, Benefits & Net Benefit with YoY performance, Portfolio health view – breakdown by Region, Phase, Complexity & Status, Interactive Timeline (Gantt-style) to track project progress, and Detailed drill-through for project-level insights; the goal: give executives a clear, actionable view of project performance — from strategic impact down to operational details — all in one place; Turning project data into insights that drive better decisions is what makes BI powerful.
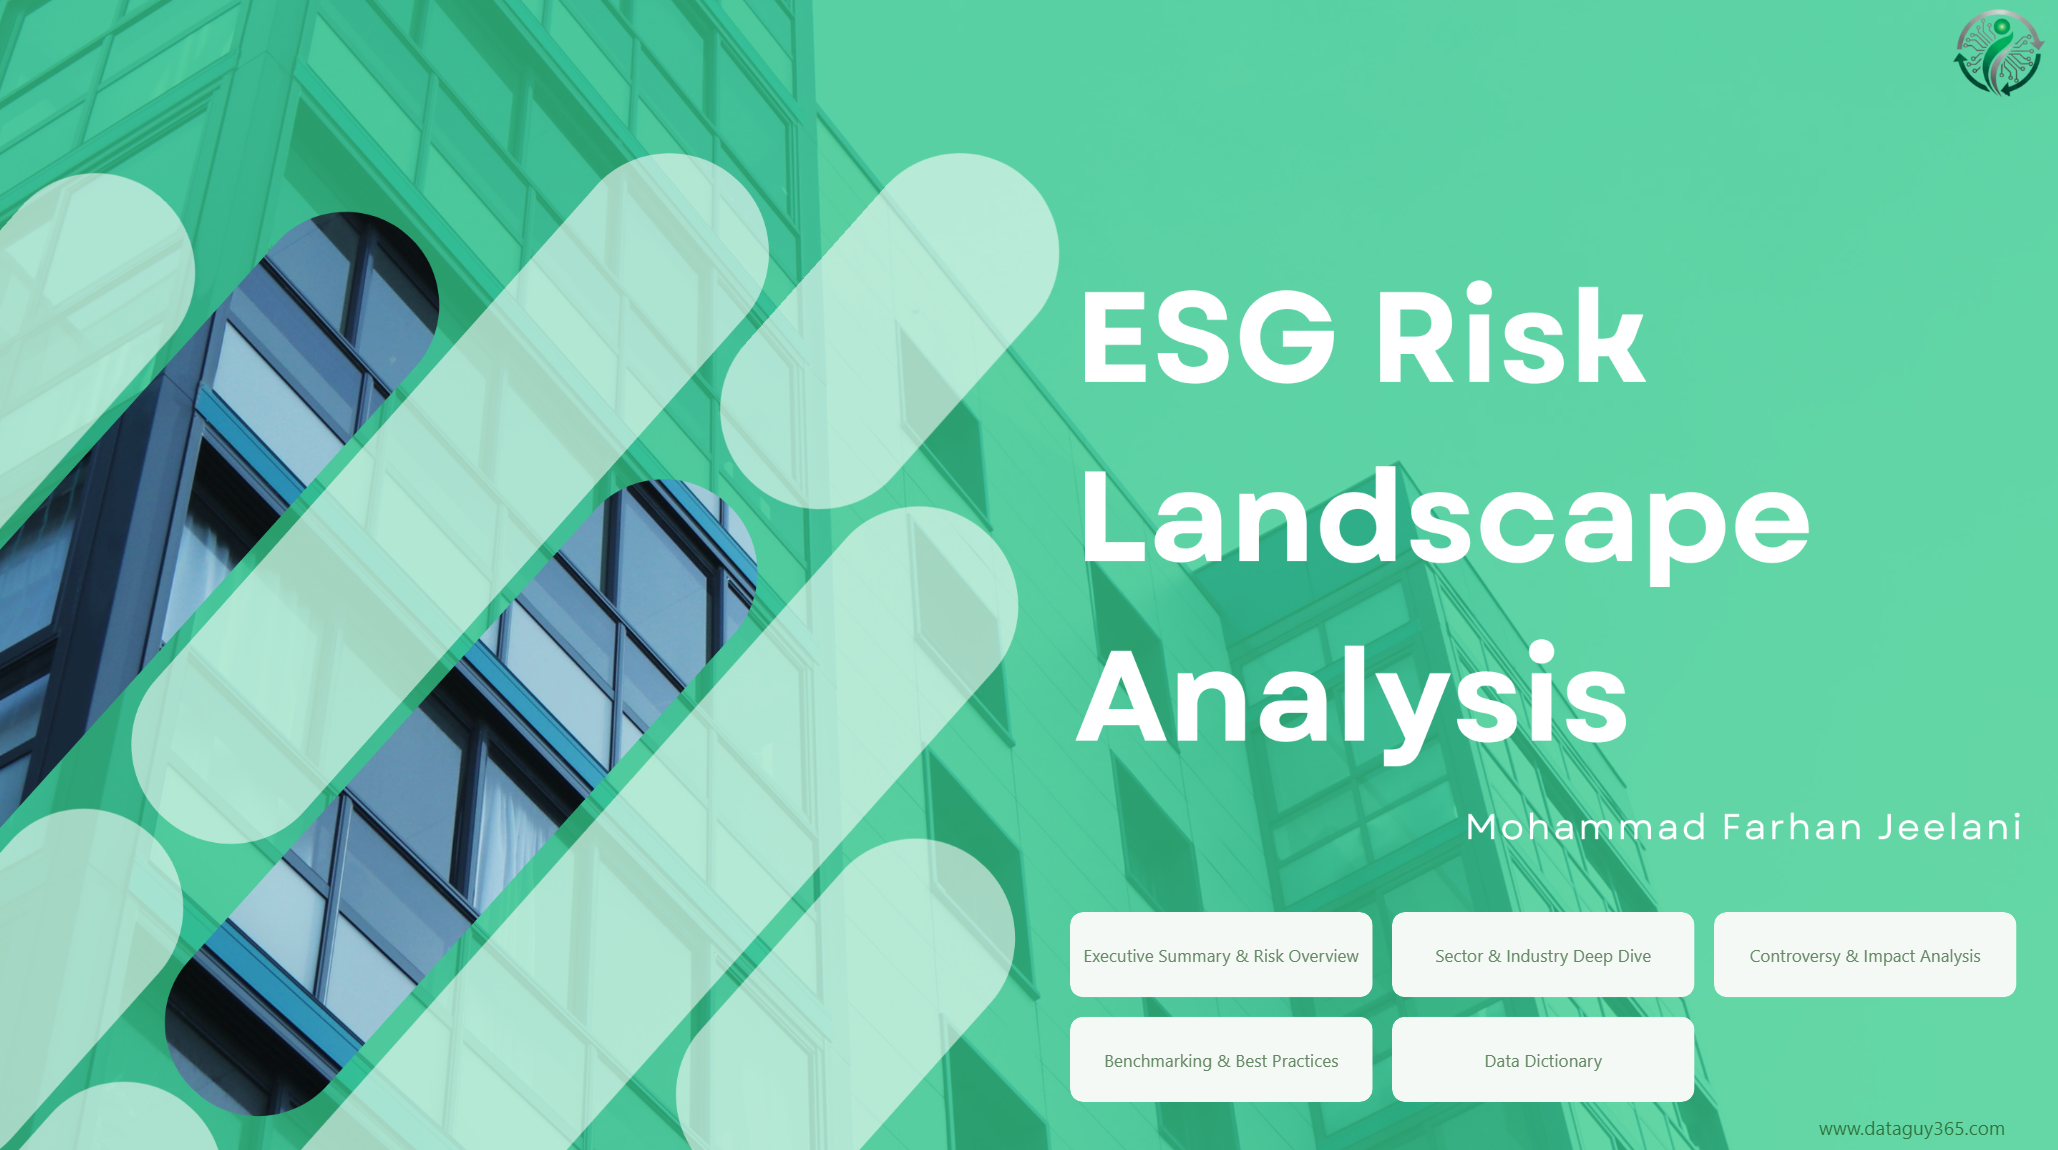
Illuminate risk, inform action, empower responsible leadership.
ESG Risk Analysis for S&P 500: This analysis assesses ESG risks across the S&P 500, identifying key risk drivers and highlighting notable companies; Overall ESG Risk: Most companies fall in the Medium risk category with a smaller group showing High or Severe risk, needing urgent attention; Risk Components: Environmental: High in sectors like Energy and Basic Materials; Governance: Issues often linked to board practices or shareholder rights; Social: Driven by labor practices, safety, and community impact; Controversies: Companies with High/Severe Controversy Levels often have higher ESG risk scores, these incidents significantly impact risk profiles; ESG Percentile: Companies in the 75th percentile or higher are among the riskiest in ESG terms; Sectors: High Risk: Energy, Basic Materials, Consumer Cyclical; Lower Risk: Technology, Financials, Healthcare (with exceptions); Notable Companies: High Risk/High Controversy: WFC, XOM, META, CAT; Low Risk/Low Controversy: XYL, WDC, WELL; Employee Count: Larger firms (e.g., Walmart, Amazon) face higher social/environmental risks due to scale.

Where data meets decisive property strategy.
The Dubai Real Estate Insights Dashboard is a centralized, visually driven cockpit for monitoring real estate performance in Dubai. It combines high-level indicators with drill-down capabilities to reveal trends, segments, and drivers across time, property types, and locations. It enables executives and analysts to track market health, sales activity, and channel contributions, explore sub-market insights with flexible filters, and compare views to assess performance. Key outcomes include quick executive briefs, identification of high-growth segments, informed allocation decisions, and data-driven strategic discussions.
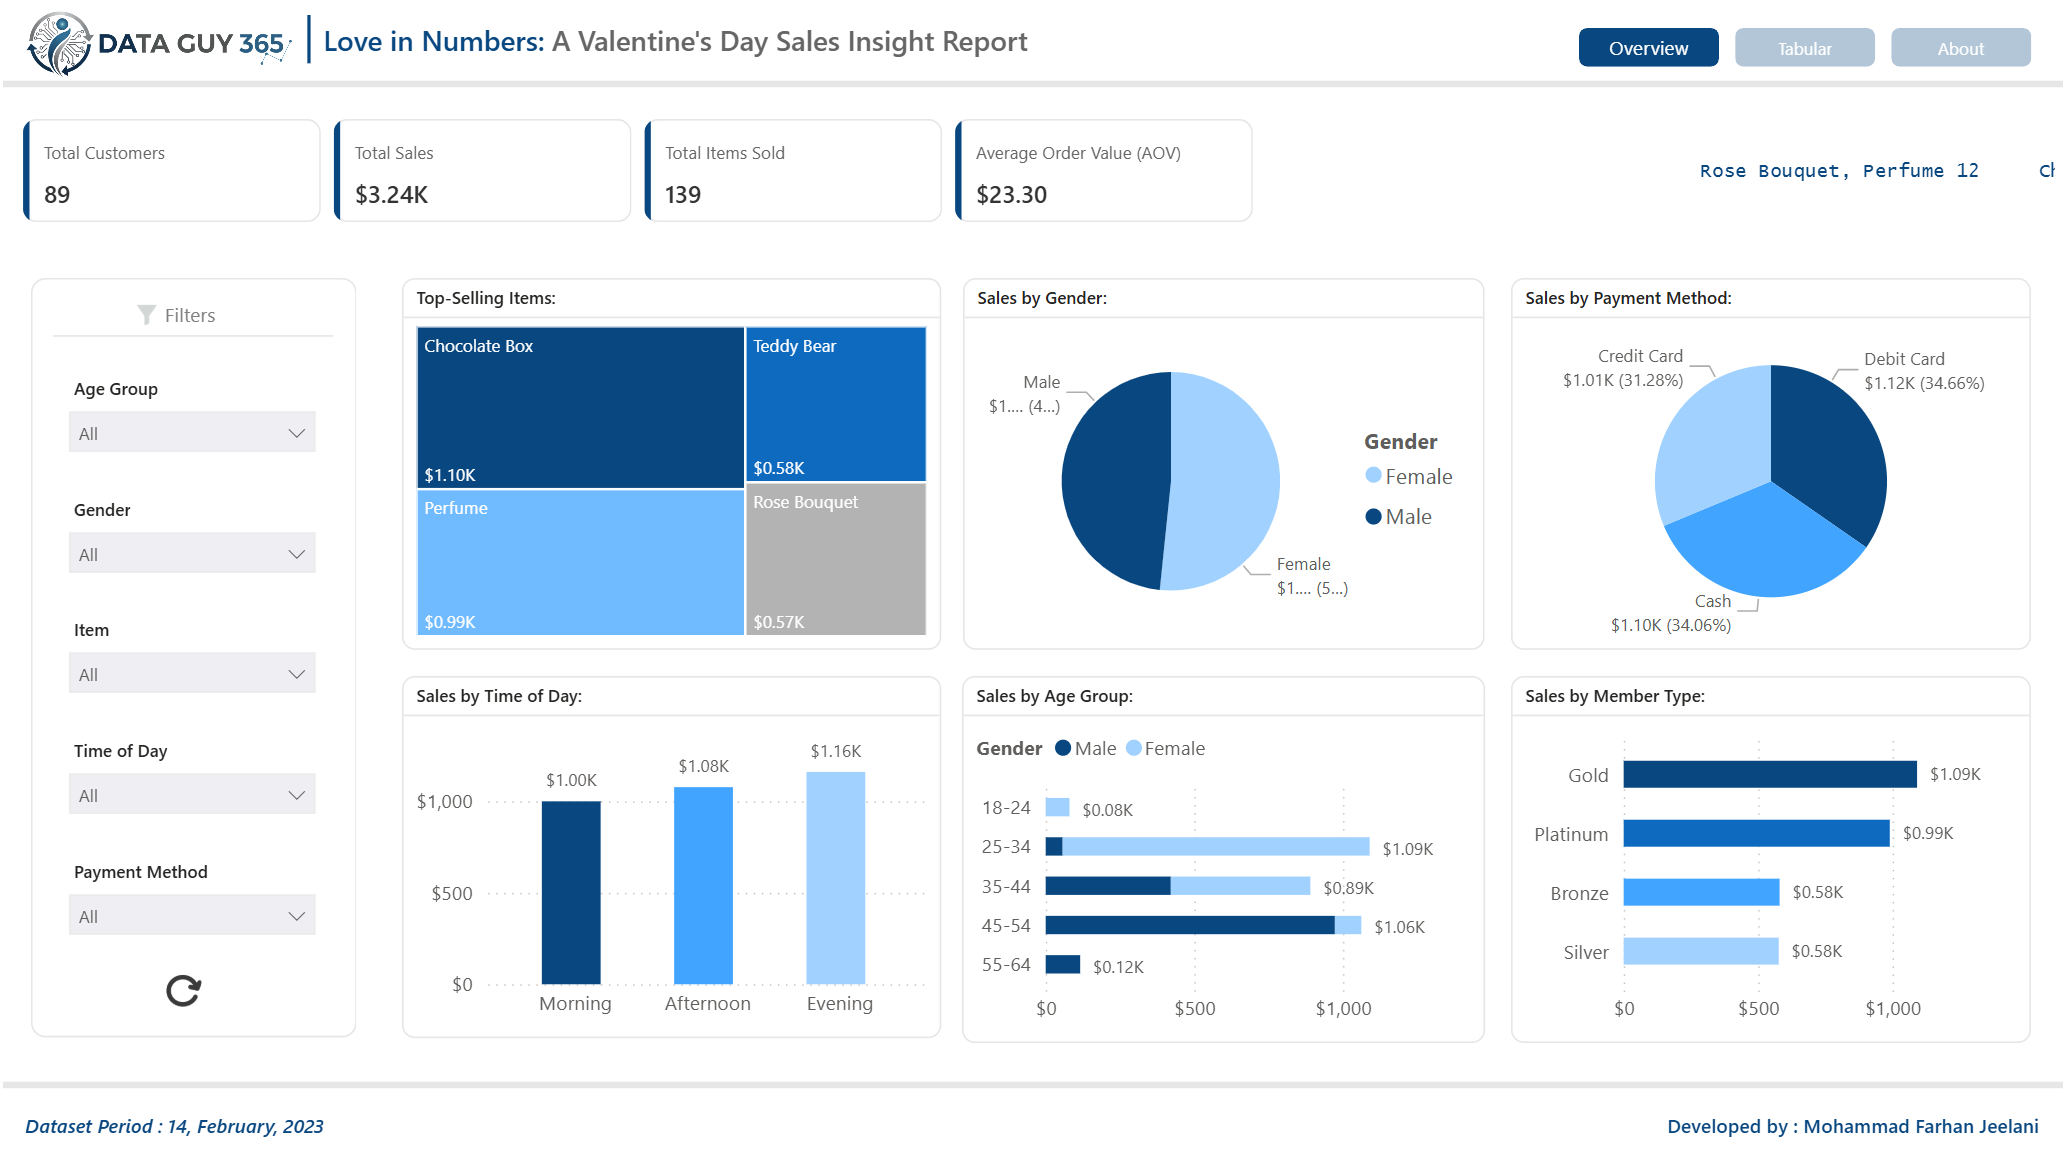
Love in Numbers – A Valentine's Day Sales Insight Report
Valentine’s Day is more than just a celebration of love—it's a major sales event that drives significant consumer spending, and this report provides a comprehensive analysis of Valentine’s Day sales trends and customer behavior to help businesses optimize future sales strategies. Key highlights include: total sales and customer spend patterns to discover how much was spent and the average order value; top-selling products and categories to identify the most popular gift choices; customer demographics and buying behavior to understand who is buying, their preferences, and how they shop; and sales by time, location, and payment methods to explore when and where sales peaked. Why this report matters: by analyzing real sales data, businesses can enhance marketing strategies, optimize inventory, and boost revenue for future Valentine’s Day campaigns. This report combines advanced analytics and interactive visuals to provide meaningful insights.